
Q3 2023 Update
Q3 2023 Update
Hello Partners,
I hope this update finds you well.
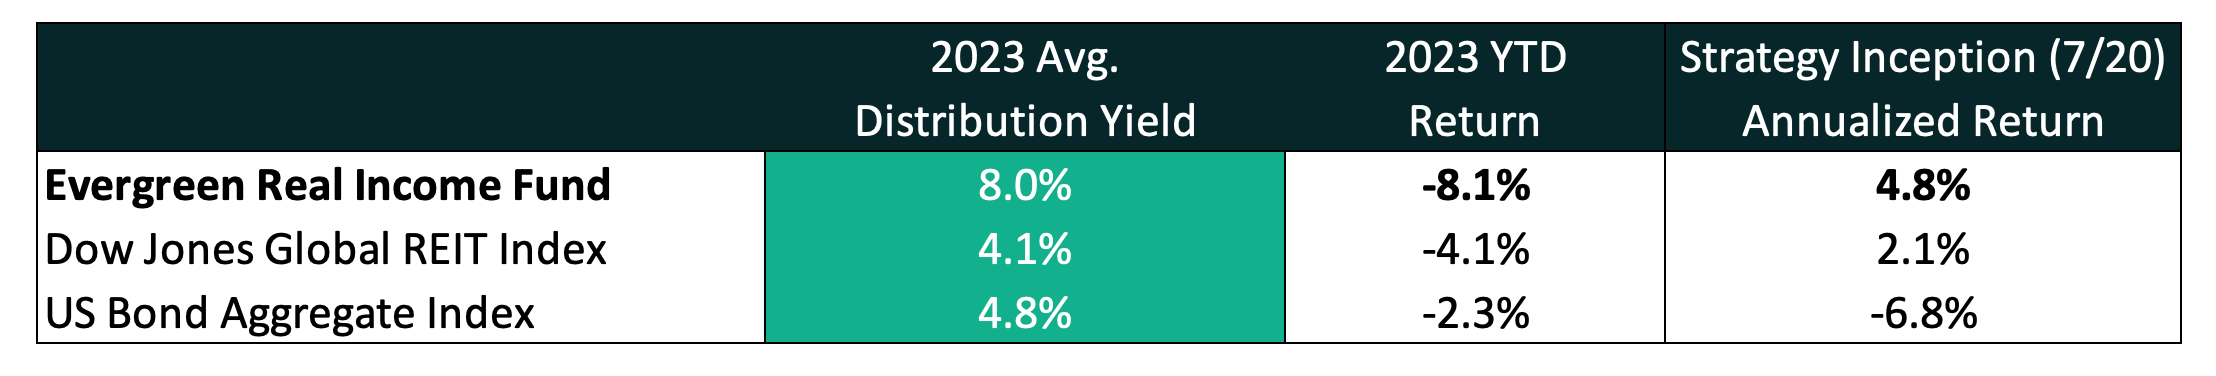
The average distribution yield for 2023 YTD is 8.0%.
Below are the YTD & historical returns for the Income Fund though the third quarter.
Economic Outlook
Bonds remain in a 2 year bear market, which has also dragged down all income related investments. This includes REITs, which are now trading at implied cap rates not seen in a decade plus.
The good news is, the Federal Reserve once again paused its rate hikes today and economic signs suggest they are at or nearing the end of their rate hiking cycle.
We don’t put much weight into economic forecasts, however there are a few things that make that probable.
Perhaps the most important of those is our fiscal deficit, which (at $1.7 trillion) is getting out of hand. Fiscal policy is becoming more of an immediate threat than inflation. Raising rates just forces the government to print more money to service more debt, thus exacerbating the problem.
But, perhaps it’s useful to hear from another investor on this point.
The below is a recent video of Barry Sternlicht (Starwood Capital CEO) who is probably in the conversation for world’s most shrewd real estate investor.
The market agrees with Barry’s forward interest rate predictions:

Tying to precisely forecast rates is a fools errand, but - at the extremes - real estate investors obviously have to pay attention.
I think it’s probable the above dot plot is directionally correct, but likely too optimistic on where rates will ultimately land in 2025 and beyond (2.9%-2.5%).
I’m firmly in the “higher for longer” camp. I think the world has repriced the cost of capital to a risk free return that is likely lower than today’s rates but a lot closer to historical averages vs. the last decade’s 0-2%.
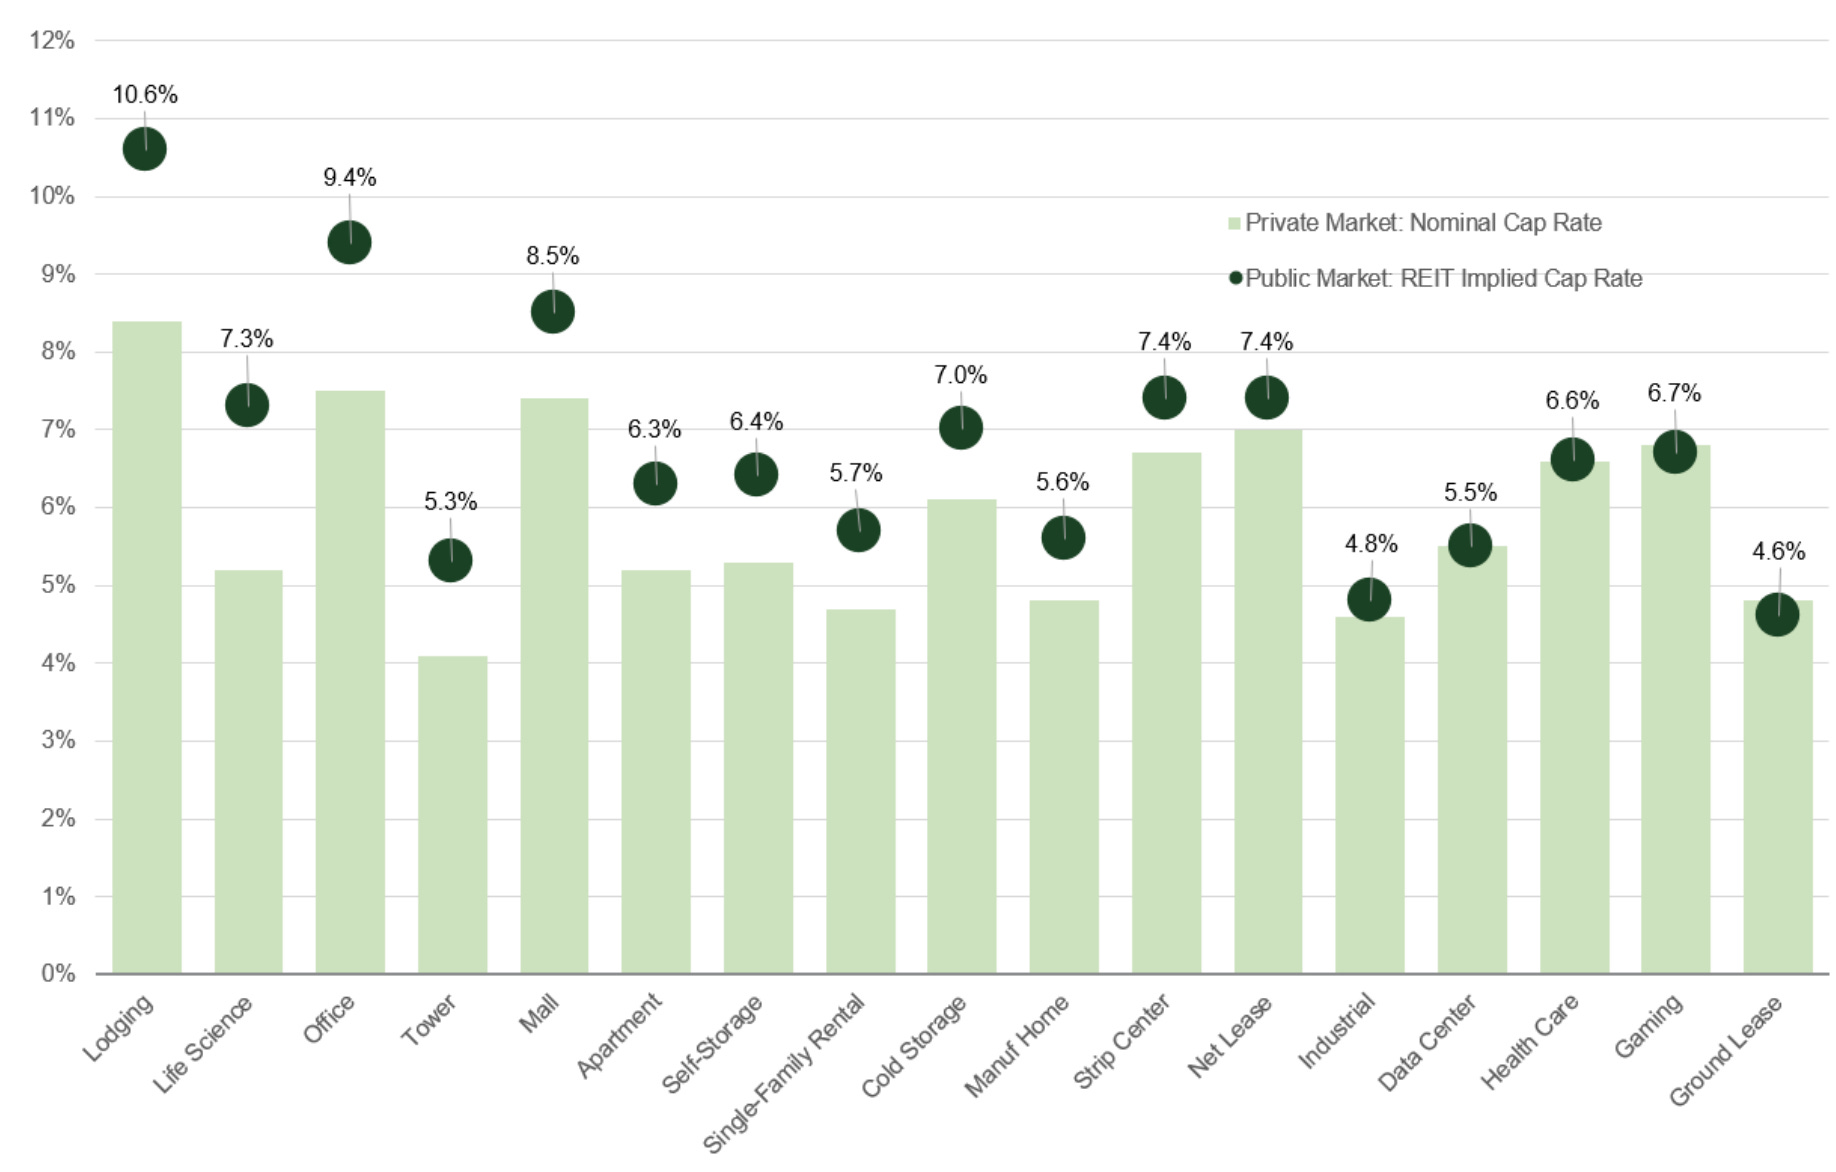
Private Market Values
As you can see from the below chart, there is still meaningful gaps between public and private real estate valuations.
Office is showing signs of life, but still seems like a value trap given the wave of available space that hits the market each day.
Lodging is cheap, but is one of our least favorite sectors and is vulnerable going into a possible recession.
Essentially, the size of these cap rate gaps can be explained by uncertainty.
While there are exceptions, the right half of the table skews to tighter spreads because investors have clearer sight-lines into tenant demand and future earnings for those sectors.
Portfolio Positioning
As detailed in prior updates, we are still favoring REITs that can reliably grow rents into economic weakness. Additionally, we have used this year’s decline in REITs as an opportunity to upgrade the overall quality of the portfolio.
A number of top-tier REITs that tend to trade at nosebleed valuations are now offering attractive 2-3 year forward returns with far lower risk than the average REIT. While I hate down performance - this is the silver lining of a bear market.
So while not fun, I think our holdings are well positioned to drive rent growth despite what may or may not happen to the economy next year.
Cash Flow Growth Drives Long-Term Returns
Despite my macro musings above, I prefer to focus on cash flow growth and look forward to the day when well can all go back to ignoring the Federal Reserve.
Because while rates and multiples drive narrative and short term results, actual cash flow drives long-term results.
3 drivers of returns for REITs:
Funds From Operations (FFO) Yield - similar to earnings or cash flow yield1
FFO Growth - similar to earnings growth
FFO multiple (contraction or expansion) - similar to P/E ratio
The FFO yields tells you roughly what dividend yield the REIT could afford to pay out each year.
For example, net lease casino owner VICI Properties ($VICI) is currently trading at a healthy 7.7% FFO yield. Because they don’t operate the buildings (the casino tenants do) and pass through all expenses to the tenants, they generate a ton of cash.
They are currently paying a 6% dividend that has room to grow, which we love. They are reinvesting the remaining cash flow (not paid via dividend) back into growing the portfolio.
To recap, REIT FFO multiples:
are historically low today (including similar periods with higher interest rates)
are discounted relative to the private market
and are likely to increase when Fed cuts interest rates
But since we don’t know when that will happen, we focus on REITs and real estate stocks that can continue growing cash flow in the face of higher (for longer) interest rates and a softer economy (possible recession).
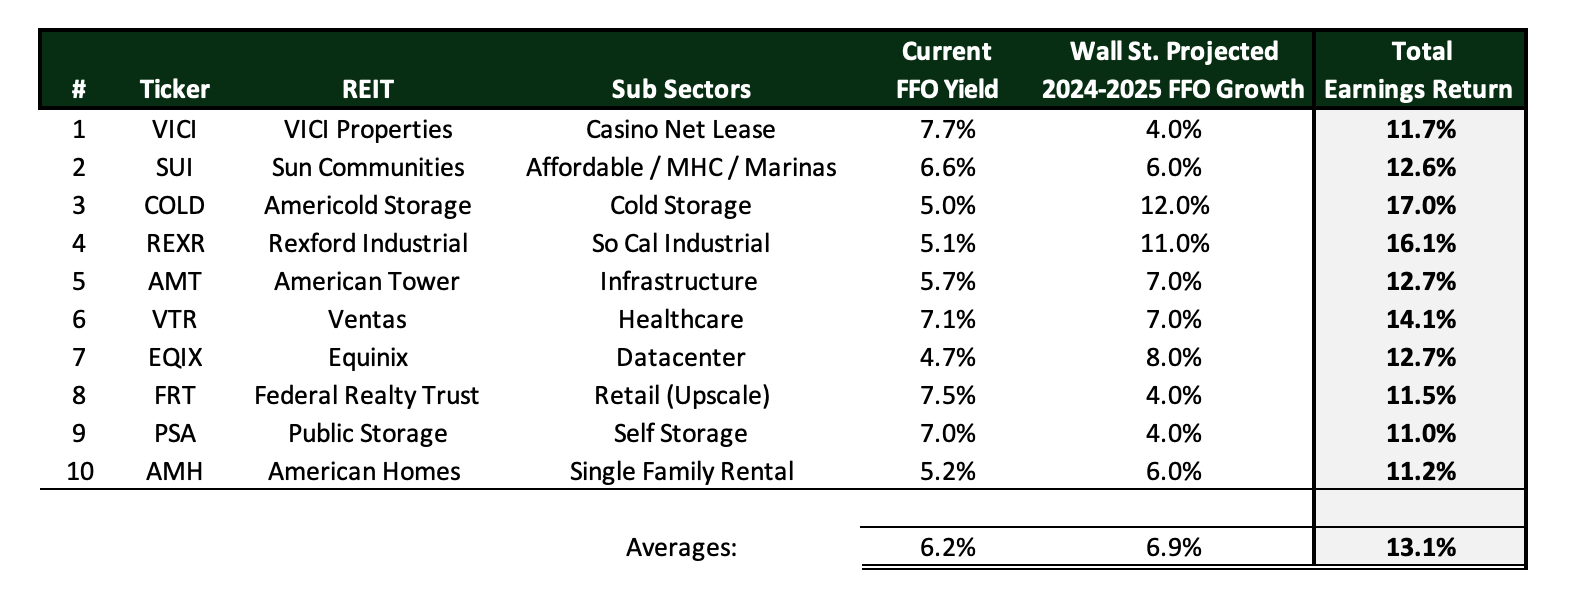
As an illustration of this, below are 10 of our core REIT holdings, their FFO yield and their projected earnings growth. The combo of these two is how the market thinks about valuation.
This is the yearly forward returns each portfolio can earn without any help from multiple expansion. If you included any FFO multiple expansion from today’s reduced valuations, most of these projected returns returns would be 20%+.
FFO Yield + Growth = Expected Return from Earnings
FFO Yield + Growth + Change in Multiple = Total Expected Return
So in other words, if the multiple is fixed, the return of a REIT is similar to real estate returns. That is just cash flow + the appreciation (which is a function of the cash flow growth).
This framework is a lot easier to forecast and stick to than trying to peg REIT multiples (or stocks P/E ratios for that matter).
Trying to guess the change in multiple requires one to triangulate and predict: interest rates, inflation, fiscal deficits, market sentiment, money supply, oil prices, and foreign wars.
To estimate cash flow earnings, you really only have to estimate demand. Future supply is obvious given we can track new construction permits and completions well in advance.
For example, this is why we’ve been underweight apartments the last couple months. Demand is there, but the industry is seeing record new supply, which should reduce rent increases in 2024.
Below is historical stock market data supporting our long-term cash flow focused strategy. Multiples and rates move stocks over the short term, earnings growth moves stocks over the the long-term.

Closing
We are starting to see more distress in apartment syndications (one off deals from smaller real estate firms marketed to retail investors). The major apartment REITs have significant balance sheet capacity and are lining up to try and take over such deals at distressed pricing.
Many of the syndicated deals purchased in 2020-2022 with floating rate debt are underwater and are unlikely to recoup investor capital unless they can somehow bridge their financing a few years.
Thankfully, we have none of those fears.
Unlike the path of interest rates or the economy - I’m certain we’ve invested in lowly leveraged, world-class real estate portfolios, whose valuations (while volatile) will ultimately recover.
Thank you,
Brad Johnson
Evergreen Capital
FFO is a reasonable proxy for cash flow for low capital intensive real estate. This is not true for REITs that require high, ongoing capital expenses such as office and hotels. For those sectors an adjusted FFO (AFFO) figures that adds back in capital expenses should be used.